

Trading involves recognizing basic chart patterns to predict market trends. They provide a strategic buy or sell signal and targets for maximum profits. Let’s study top chart patterns and ways to trade them.
Trading with up to 90% profit
What are chart patterns?
They’re a trader’s best friends. Charts give traders a pictorial representation of all that happens in the market and provides patterns of events that traders can analyze to direct their decision-making and predict possible events.
Over time, specific regular patterns have been identified, and traders who understand how to trade with them have been able to develop solid trading patterns and gain an impressive competitive advantage in the stock market.
Effective strategies in your mailbox
Subscribe and discover a fund of trading knowledge
Great! Please check your email
We’ve sent you an email to confirm your subscription
Something went wrong
Try reloading the page. If that doesn’t help, please try again later
What are the major types of pleasure zone-chart patterns?
A chart pattern may take a few days, weeks, months, or even years to develop. Traders over the years have learned to recognize these patterns. This helps prepare for possible market changes, plan strategic moves and escape heavy market losses.
The three main categories of chart patterns are; Reversal Patterns, Continuation Patterns, and Bilateral Patterns. There are several pattern designs under each category and your job as a trader is to recognize the most common types with high probabilities of success. Those are your pleasure peak patterns.

Reversal patterns indicate a change in the direction of market trends, while continuation patterns predict the continuation of an existing trend. Bilateral patterns point out the volatility of market trends. They simply indicate that anything could happen. Examples of continuation patterns include; Symmetrical triangles, Ascending or Descending triangles, Flags, and Pennants, while The head and shoulders pattern, falling and rising wedges, and double or triple tops and bottoms are all reversal patterns.
How to start trading with $200 and minimum risk
Don’t let a small budget deter you from trading! Learn how to start trading with $100 or $200 and make the most out of this money!
Read more

The top pleasure peak patterns you must know
Several market experts say that trading with precision isn’t necessarily about the patterns but your interpretation and course of action in response to these market trends. In a way, they are right. Knowing the different successful patterns is useless when you constantly make wrong decisions. Here are some of the top patterns every trader should learn how to trade for maximum benefits;
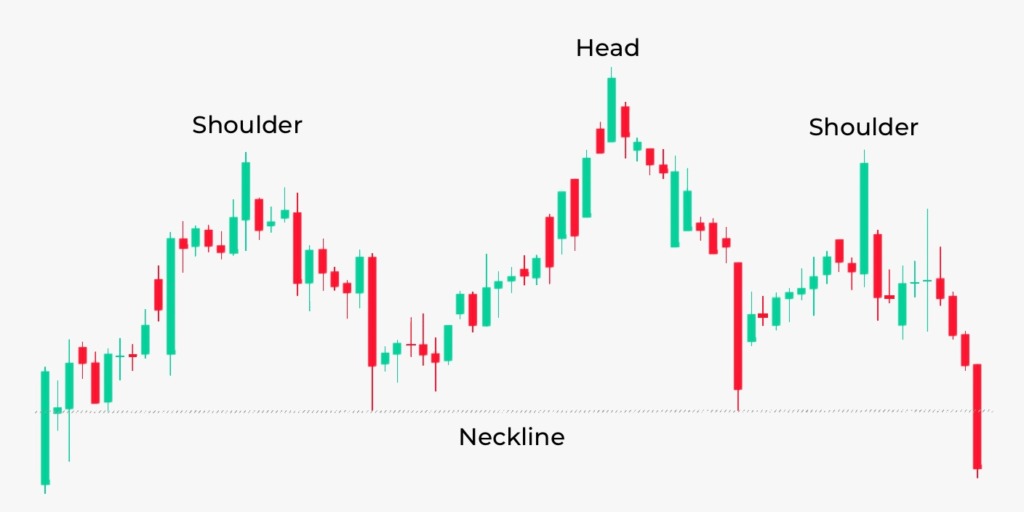
1. Head and Shoulders Pattern
This takes the top of the list as one of the most reliable reversal chart patterns. It has three peaks; a large one in the middle and one small peak on each side i.e., the head and shoulder peaks, respectively. The head represents the sellers taking control and pushing prices lower. The left shoulder indicates a market pullback, and the right indicates an attempt by buyers to push up the price, which has failed.
Recommendation—
Understand the market structure and pay attention to the duration of the pattern. Instead of the general method of trading in the direction of the breakout, you should try trading breakout with buildup. Wait for the left shoulder and head to form, allow the price to move back to the head, go short at a price rejection, then stop moving back to the head, go short at a price rejection, then stop your loss 1ATR above the swing high.
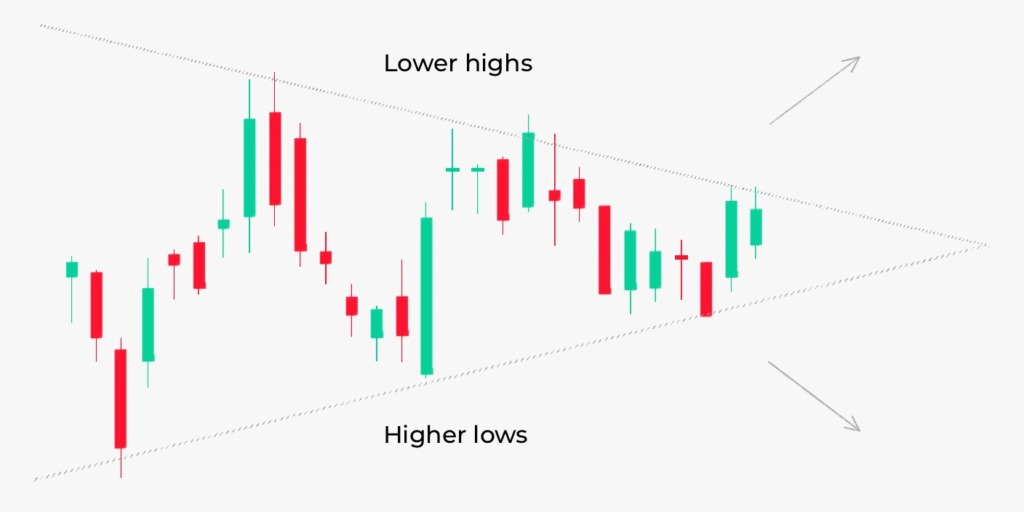
2. Symmetrical Triangles
These are continuation patterns. You expect a breakout on the side of the stronger trend as the trendlines converge. This pattern resembles a funnel and takes a few months to form fully.
Recommendation—
Do not chase the breakout. Observe the trend and trade with it. Using techniques like trailing your stop loss can maximize your profits. Try using the 20MA to ride short-term trends and the 200MA for long-term trends.
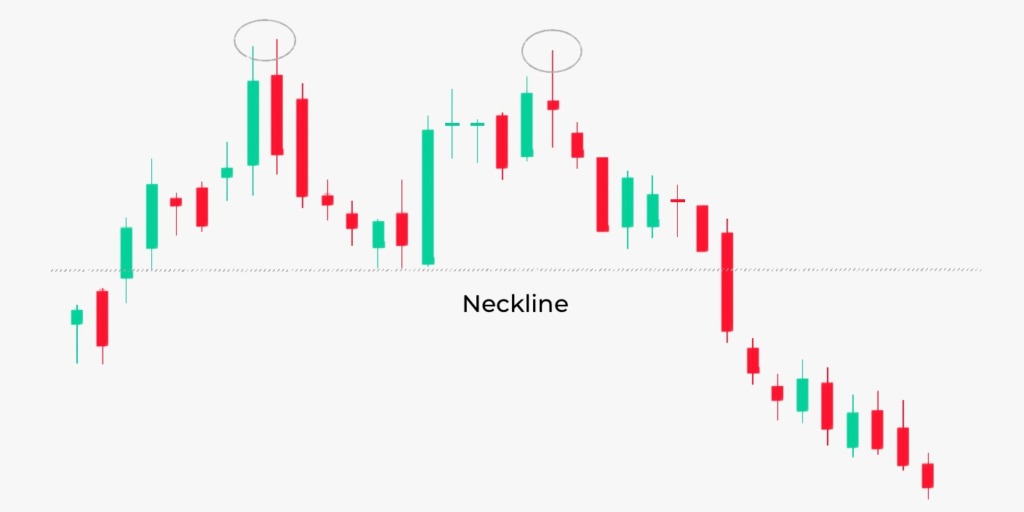
3. Double top
This pattern resembles the letter M. There are two peaks with nearly equal heights. It usually indicates the end of an upward trend.
Recommendation—
Do not be in a hurry to short when this pattern occurs in a strong upward trend. To make clever profits from a breakout, wait for a buildup, trail your stop loss, and take your time.
Bottom line
There are several other chart patterns you can expect in the market and basic rules on how to trade safely with them. Certain situations will require foresight and a few pro tips to maximize your profits and avoid common trade traps.
Earn profit in 1 minute
<span>Like</span>