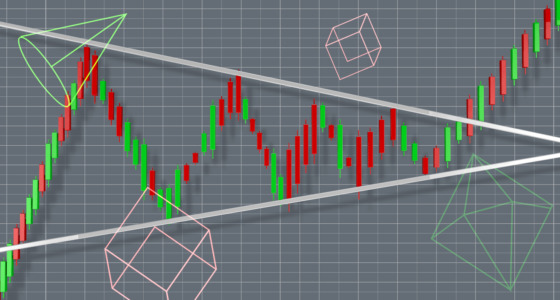

The Heikin-Ashi chart is very similar to Japanese candlesticks. However, it provides a clearer view of price trends.
A trend is a key to successful trading. There is a well-known phrase, “Don’t fight the tape,” meaning traders shouldn’t trade against the market trend. The term goes back to the ticker tape used to transfer stock prices.
Read this Heikin-Ashi candlesticks tutorial to learn how to trade using the Heikin-Ashi chart.
Heikin-Ashi vs. Japanese candlesticks
Heikin-Ashi (also spelled Heiken-Ashi) is a chart type that looks similar to a traditional candlestick chart but differs in how the candles are calculated. If you glimpse the Japanese candlestick and Heikin-Ashi charts, you will see similar candles with a body, shadows, and the same colors. However, if you compare their values, you will notice a difference.
Japanese candlesticks are based on open, high, low, and close assets’ values for a certain period (timeframe). Heikin-Ashi candles are calculated with a specific formula that considers two-period averages. This calculating method makes the chart smoother, erasing the market noise. This allows traders to catch trends and price reversals quicker.
Why should you use candlesticks if the Heikin-Ashi chart is so effective and provides similar data to Japanese candlesticks? Heikin-Ashi hides price gaps and some data. The best way to use this chart type is to combine it with Japanese candles.
How to read Heikin-Ashi candlesticks
A Heikin-Ashi candlestick has open, close, low, and high prices. However, it’s more important to look at the size of its body and the existence of shadows.
A unique feature of Heikin-Ashi candlesticks is that the lack of shadows reflects the strength of a trend.
- A strong uptrend is represented by candles without lower shadows.
- In the strong downtrend, candlesticks don’t have upper shadows.
Such shadows are called “shaved.” A candle without a lower shadow is called a shaved bottom. A candlestick without an upper shadow is called a shaved head.
When candlesticks have small bodies and long shadows, it’s a sign of a market balance. This means neither bulls nor bears can take control of the market. Such candles usually precede a price reversal.
How to trade with Heikin-Ashi candlesticks?
Aside from trend direction, this price chart can help you in some other cases.
1. Heikin-Ashi candlestick – trend analysis
As the Heikin-Ashi candles have the same color as Japanese candlesticks, you can easily spot the direction of a trend. If the price rises, candles are green or white. If the price falls, the candlesticks are red or black. As mentioned above, the trend’s strength is identified by the lack of shadows.
2. Heikin-Ashi candlestick – price reversal
If you are familiar with Japanese reversal candlesticks, you will find them on the Heikin-Ashi chart. They will also have long upper and lower shadows and small bodies. Most candlesticks in the sideways market will be doji or spinning top.
3. Heikin-Ashi candlestick – chart patterns
As the price is smoothed, it’s much easier to determine trends and patterns. Japanese candlestick charts consist of candles that frequently change their direction and color. Therefore, traders are sometimes confused by the signals they provide.
The Heikin-Ashi chart mainly consists of more consecutive colored candles. Therefore, it’s much easier to define previous price movements. Still, you won’t be able to spot some patterns because the Heikin-Ashi chart doesn’t reflect price gaps. This will lower your chances of catching trading signals.
4. Heikin-Ashi candlestick – fewer false signals
There are fewer false signals when the market moves sideways or in large price ranges. This prevents traders from making wrong decisions.

Heikin-Ashi candlesticks: limitations
Despite numerous advantages, this chart type has some pitfalls. It’s vital to consider them when predicting the price direction.
1. Wrong prices
Although every Heikin-Ashi candlestick has high, low, open, and close prices, you should remember that these aren’t actual asset values for a certain period, as the Heikin-Ashi calculation is based on average prices. Let’s consider an example.
On the daily Heikin-Ashi chart of EUR/USD, there is a red candlestick with an open price of 1.0519 and a close price of 1.0449.
On the daily Japanese-candlestick chart of EUR/USD, the candlestick of the same period is green and has an open price of 1.0441 and a close price of 1.0483.
The Euro rose against the US dollar on that day. Therefore, if you used the Heikin-Ashi chart to forecast the price direction, you would fail. However, the green candlestick on the Japanese candlestick chart would confuse you regarding the overall trend. Therefore, it’s vital to separate the charts. Spot general trends on Heikin-Ashi and check actual prices on Japanese candlesticks.
2. Not suitable for short-term trades
The primary purpose of the Heikin-Ashi chart is to reflect a trend’s strength. Each candle is calculated based on the previous candle’s value. Therefore, it takes time for a trade setup to form. Scalpers and day traders need to react to price movements fast. When using the Heikin-Ashi chart, they risk missing signals.
Takeaway
The Heikin-Ashi chart helps swing and position traders to spot market trends by erasing fake signals. It’s a good assistant for Japanese candlesticks. You will succeed in long-term trades if you learn how to combine these chart types.


